DevTools are an invaluable part of an web engineers toolkit. Here's a few things that you might not have known.
1) Full page screenshots
You can capture a screenshot of a specific node. Just select the element, hit 'cmd+shift+p', and type 'capture node screenshot'
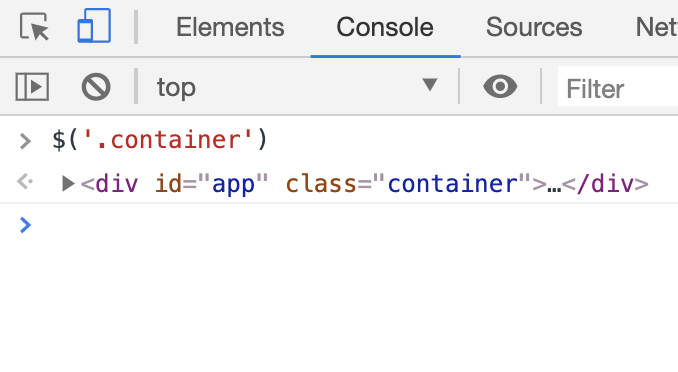
2) jQuery style variables
Just can't let go of jQuery? When selecting elements in the console, use $ as an alias for document.querySelector
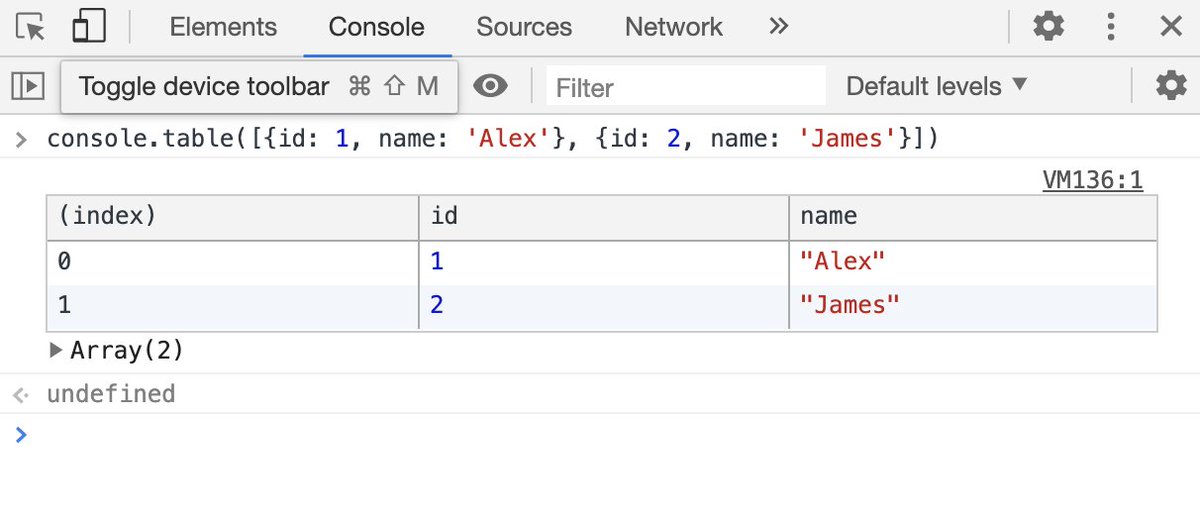
3) console.table
Want to log an array of data? Use console.table() and your array will be rendered in to a table
4) CSS shortcuts
Trying to work out where an element is inheriting a particular style from? Use the 'computed' style tab to view the properties that are rendered along with a link to what selector is adding that property.
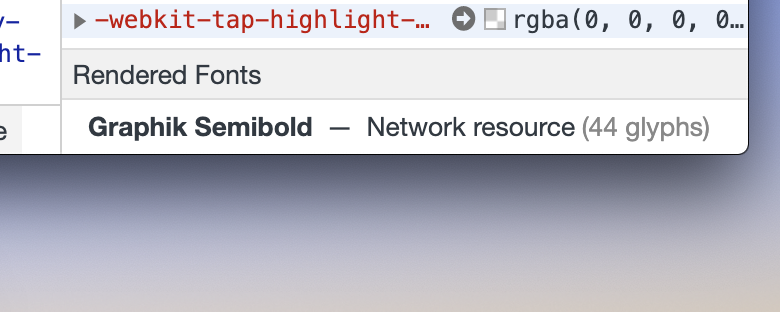
5) What the font
You can also view the font that is rendered in the computed style tab, along with whether it's a local or network font.
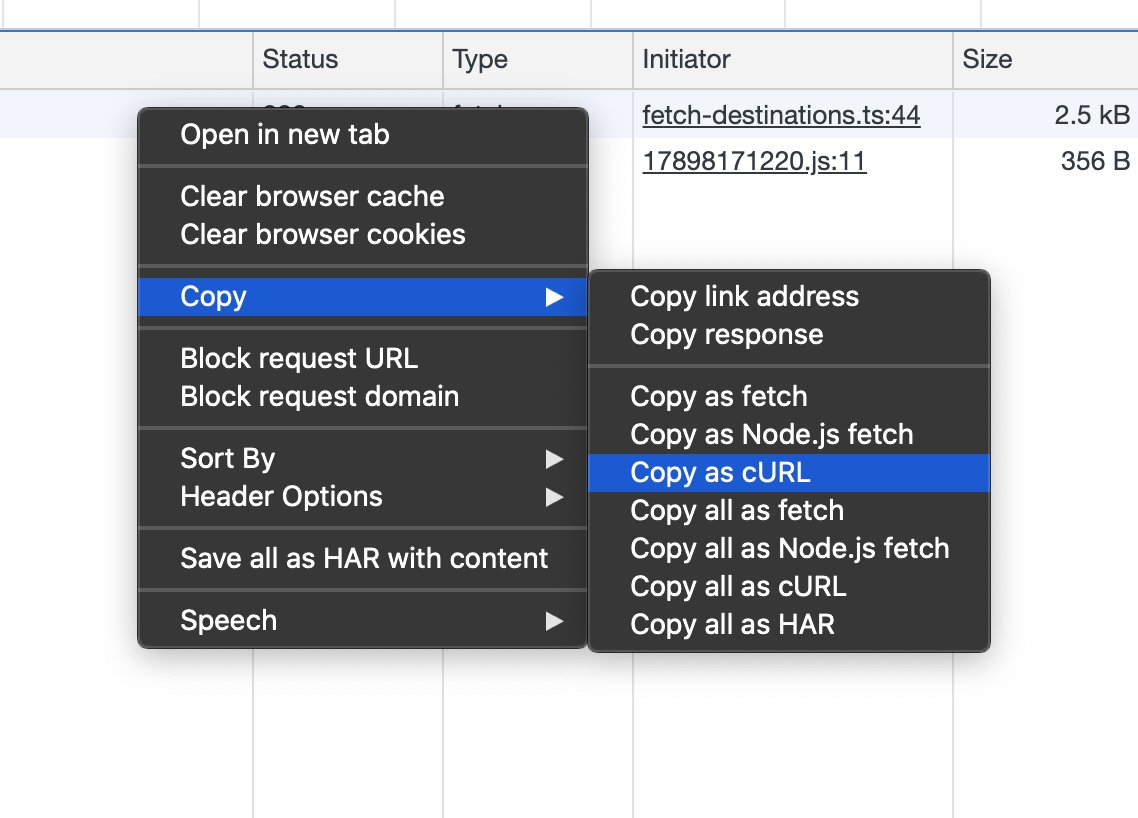
6) Debugging network requests
Trying to debug a network request? Right-clicking the request in the Network tab will allow you to copy the request in a range of pre-formatted requests.
7) Image as a data URI
Select an image in the Application tab to quickly get it as a data URI

These tips were originally posted in this thread on Twitter